The Big Data Lab supports student projects, as well as all kinds of research projects. This requires us to store, process and serve many different kinds and formats of data.
To do that, we use, among other things, Apache Drill as a query engine. It can handle many different types of data sources, the most interesting for us being Apache Kafka and HDFS. It can read our most used filetypes: CSV, JSON and parquet. With a single query, we can join different data sources and formats. Drill uses a datastore-aware optimizer which automatically restructures a query plan to leverage the datastore’s internal processing capabilities. In short, it is very attractive for our use-case.
Some time back, we deployed Drill and saw decent performance. We used Apache drill heavily for reading parquet and JSON files. However, with time our datasets grew larger and response time varied heavily for unknown reasons.
Background
To understand what causes the performance variation, we focused on one specific case where the performance decrease was most notable: our BIMSIM project. In this project, we are gathering large amounts of environmental sensory data for research purposes. At the current time (20.07.2023), we store 340.909.558 measurements, while still gathering more every day. If you want to learn more about this project, please check out bimsim.
Apache Drill
Before zooming in on the problem, it is important to understand how drill plans queries, or more specifically, how it parallelizes the query execution.
The following is an excerpt from the official Apache drill documentation found here .
> A parallelizer […] transforms the physical plan into multiple phases, called major and minor fragments. These fragments create a multi-level execution tree that rewrites the query and executes it in parallel against the configured data sources, sending the results back to the client or application. Please take special note of the following description of the major and minor fragments.
> Major fragments do not actually perform any query tasks. Each major fragment is divided into one or multiple minor fragments […] that actually execute the operations required to complete the query and return results back to the client.
> The parallelizer […] creates one or more minor fragments from a major fragment at execution time, by breaking a major fragment into as many minor fragments as it can usefully run at the same time on the cluster. Drill executes each minor fragment in its own thread as quickly as possible […].
The Problem
SELECT * FROM dfs.storage.sensor_data order by `timestamp` LIMIT 10; When querying the sensor data, with for example the query above, we noticed execution times of one to up to three minutes, seemingly depending on the day. This is very low performance, considering the ~20GB we are querying is a relatively low amount of data for a cluster the size of ours. Drill’s query profile reveals that~97% of the execution time is spent within a single major fragment, e.g. major fragment `03-xx-xx` in the query profile below.
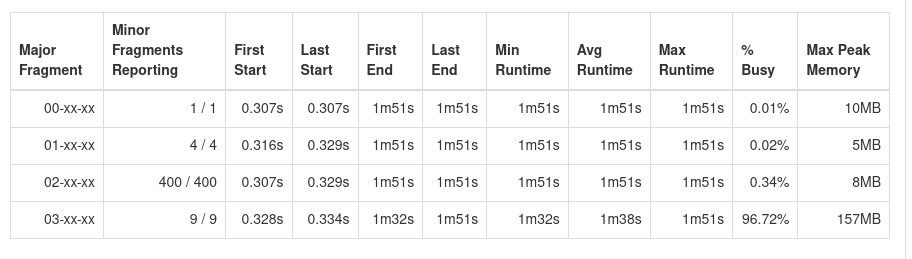
`03-xx-xx` is responsible for the `JSON_SUB_SCAN`, `UNION_ALL`, `PROJECT` and the `PARQUET_ROW_GROUP_SCAN` operators. In other words, it reads the data from our HDFS. Reading data from our HDFS is a highly parallelizable task since we have 4 HDFS data nodes matching 4 drillbits. However, Drill only breaks this task into 9 minor fragments, which means the data is read with only 9 threads. (see „minor Fragments Reporting“ in figure x) This is a very low amount of threads and explains the low performance. But why only 9 threads?
Zooming in
At the time of writing, we have 20GB worth of data, stored in 160 Parquet files ranging from 2020-01-31 up to 2023-06-29 which we save in HDFS and regenerate monthly. The data is stored in parquet files with a size of 128MB which matches our HDFS blocksize.
This data is called `history_data`. We UNION these files with JSON files which have more recent data and are written one for each day of the month. At the time of writing, we store 9 (!) JSON files ranging from 2023-07-01 up to today (2023-07-09). For those curious, this is how we currently create the view for this data:
CREATE VIEW sensor_data AS (
  SELECT
    `timestamp`,
    measurement_count,
    version,
    serial_number,
    co2_ppm,
    temperature_celsius,
    relative_humidity_percent
    from dfs.storage.history_data
UNION
  SELECT
    CAST(d AS INT) AS `timestamp`,
    CAST(m AS INT) AS measurement_count,
    CAST(v AS VARCHAR) AS version,
    CAST(s AS VARCHAR) AS serial_number,
    CAST(c AS INT) AS co2_ppm,
    CAST(t AS DOUBLE) AS temperature_celsius,
    CAST(r AS DOUBLE) AS relative_humidity_percent,
  FROM dfs.storage.`raw_monthly/2023-07/*.json`);
Understanding the symptoms
Since we knew that the performance varied, seemingly based on the day, we compared the number of minor fragments for the major fragment in charge of reading the data and found out that, in fact, the performance DOES change depending on the day.
At the first of the month, only a single minor fragment read our data. On the 31st of the month, 31 minor fragments read our data.
In our case, this means the amount of minor fragments is always equal to the amount of JSON files drill has to read.
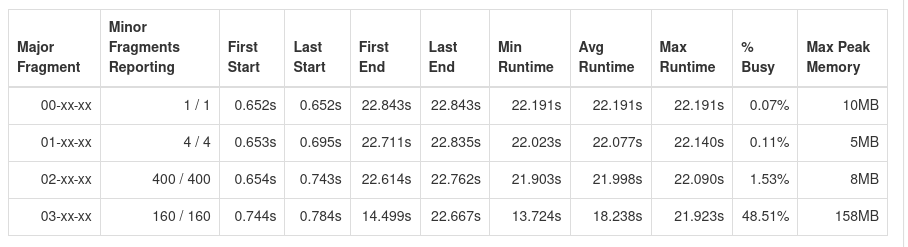
To test this, we spread the data stored in the JSON files over 160 files instead of 9, the same amount of files as our parquet files.
This revealed that there is indeed a relation between the amount of JSON files and parquet files drill wants to read.
The cause
We seem to be bottlenecked by drills parallelizer, which in our case seems to set the number of minor fragments to the minimum between the number of parquet files and the number of JSON files.
# minorfragements = MIN(# parquet files, # json files)In the issue we posted to drill github repository, we were asked to upgrade our drill version before anything. This is fair enough, considering we are using version 1.17, which is years old at this point. While preparing for the upgrade, we decided to increase our performance through unconventional means: fighting the symptoms instead of the cause.
Unconventional means
Because we are currently busy setting up a huge new cluster, upgrading drill has a low priority and will be delayed weeks into the future. But since our data is queried every day, we wanted solve the problem anyway, while spending as little time as possible on a temporary solution.
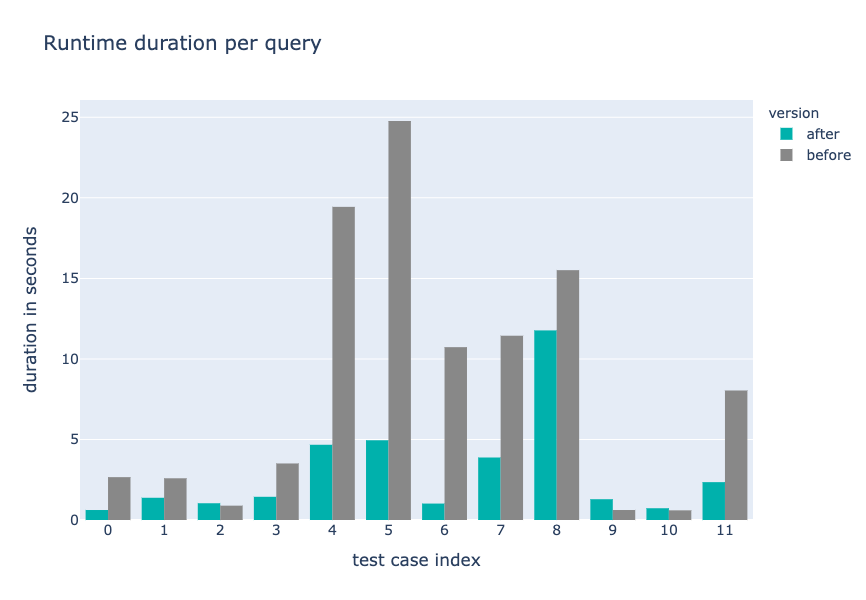
So we decided to change nothing, except write 160 empty JSON files per month while deleting all 160 empty files of the prior month. This reduces query runtime duration by 65% while only taking a few minutes to write a script to automate file creation and deletion. The speedup is especially noticeable in queries that filter for recent data, where we can see that the query runtime duration has decreased by 80%. Below, you can find a detailed benchmark of different queries that we commonly use.
Benchmark
Details
| seconds | query | test case index | version |
| 0.62 | SELECT co2_ppm, measurement_count, relative_humidity_percent, serial_number, temperature_celsius, timestamp, version FROM dfs.co2meter.sensor_data_v2 WHERE timestamp >= UNIX_TIMESTAMP('2023-09-06 00:00:00') limit 100 | 0 | after |
| 2.66 | SELECT co2_ppm, measurement_count, relative_humidity_percent, serial_number, temperature_celsius, timestamp, version FROM dfs.co2meter.sensor_data_v1 WHERE timestamp >= UNIX_TIMESTAMP('2023-09-06 00:00:00') limit 100 | 0 | before |
| 1.38 | SELECT co2_ppm, measurement_count, relative_humidity_percent, serial_number, temperature_celsius, timestamp, version FROM dfs.co2meter.sensor_data_v2 WHERE timestamp >= UNIX_TIMESTAMP('2023-09-05 00:00:00') limit 100 | 1 | after |
| 2.59 | SELECT co2_ppm, measurement_count, relative_humidity_percent, serial_number, temperature_celsius, timestamp, version FROM dfs.co2meter.sensor_data_v1 WHERE timestamp >= UNIX_TIMESTAMP('2023-09-05 00:00:00') limit 100 | 1 | before |
| 1.04 | SELECT co2_ppm, measurement_count, relative_humidity_percent, serial_number, temperature_celsius, timestamp, version FROM dfs.co2meter.sensor_data_v2 WHERE timestamp >= UNIX_TIMESTAMP('2022-01-01 00:00:00') limit 100 | 2 | after |
| 0.89 | SELECT co2_ppm, measurement_count, relative_humidity_percent, serial_number, temperature_celsius, timestamp, version FROM dfs.co2meter.sensor_data_v1 WHERE timestamp >= UNIX_TIMESTAMP('2022-01-01 00:00:00') limit 100 | 2 | before |
| 1.44 | SELECT to_timestamp( min( timestamp ) ) as mini, to_timestamp( max( timestamp ) ) as maxi FROM dfs.co2meter.sensor_data_v2 | 3 | after |
| 3.51 | SELECT to_timestamp( min( timestamp ) ) as mini, to_timestamp( max( timestamp ) ) as maxi FROM dfs.co2meter.sensor_data_v1 | 3 | before |
| 4.67 | SELECT co2_ppm, measurement_count, relative_humidity_percent, serial_number, temperature_celsius, timestamp, version FROM dfs.co2meter.sensor_data_v2 WHERE version LIKE '1.1%' AND timestamp >= UNIX_TIMESTAMP('2023-05-19 00:00:00') order by timestamp limit 100 | 4 | after |
| 19.44 | SELECT co2_ppm, measurement_count, relative_humidity_percent, serial_number, temperature_celsius, timestamp, version FROM dfs.co2meter.sensor_data_v1 WHERE version LIKE '1.1%' AND timestamp >= UNIX_TIMESTAMP('2023-05-19 00:00:00') order by timestamp limit 100 | 4 | before |
| 4.95 | SELECT co2_ppm, measurement_count, relative_humidity_percent, serial_number, temperature_celsius, timestamp, version FROM dfs.co2meter.sensor_data_v2 WHERE version LIKE '1.1%' AND timestamp >= UNIX_TIMESTAMP('2023-09-01 00:00:00') order by timestamp limit 100 | 5 | after |
| 24.77 | SELECT co2_ppm, measurement_count, relative_humidity_percent, serial_number, temperature_celsius, timestamp, version FROM dfs.co2meter.sensor_data_v1 WHERE version LIKE '1.1%' AND timestamp >= UNIX_TIMESTAMP('2023-09-01 00:00:00') order by timestamp limit 100 | 5 | before |
| 1.02 | SELECT co2_ppm, measurement_count, relative_humidity_percent, serial_number, temperature_celsius, timestamp, version FROM dfs.co2meter.sensor_data_v2 WHERE serial_number LIKE 's_e8db84c5f33d_281913' AND timestamp >= UNIX_TIMESTAMP('2023-05-19 00:00:00') limit 100 | 6 | after |
| 10.73 | SELECT co2_ppm, measurement_count, relative_humidity_percent, serial_number, temperature_celsius, timestamp, version FROM dfs.co2meter.sensor_data_v1 WHERE serial_number LIKE 's_e8db84c5f33d_281913' AND timestamp >= UNIX_TIMESTAMP('2023-05-19 00:00:00') limit 100 | 6 | before |
| 3.88 | SELECT co2_ppm, measurement_count, relative_humidity_percent, serial_number, temperature_celsius, timestamp, version FROM dfs.co2meter.sensor_data_v2 WHERE co2_ppm < 300 and temperature_celsius > 20 limit 100 | 7 | after |
| 11.44 | SELECT co2_ppm, measurement_count, relative_humidity_percent, serial_number, temperature_celsius, timestamp, version FROM dfs.co2meter.sensor_data_v1 WHERE co2_ppm < 300 and temperature_celsius > 20 limit 100 | 7 | before |
| 11.77 | SELECT count(*) FROM dfs.co2meter.sensor_data_v2 | 8 | after |
| 15.51 | SELECT count(*) FROM dfs.co2meter.sensor_data_v1 | 8 | before |
| 1.29 | SELECT co2_ppm, measurement_count, relative_humidity_percent, serial_number, temperature_celsius, timestamp, version FROM dfs.co2meter.sensor_data_v2 LIMIT 1 | 9 | after |
| 0.62 | SELECT co2_ppm, measurement_count, relative_humidity_percent, serial_number, temperature_celsius, timestamp, version FROM dfs.co2meter.sensor_data_v1 LIMIT 1 | 9 | before |
| 0.73 | SELECT co2_ppm, measurement_count, relative_humidity_percent, serial_number, temperature_celsius, timestamp, version FROM dfs.co2meter.sensor_data_v2 WHERE co2_ppm < 300 OR temperature_celsius < 15 limit 100 | 10 | after |
| 0.6 | SELECT co2_ppm, measurement_count, relative_humidity_percent, serial_number, temperature_celsius, timestamp, version FROM dfs.co2meter.sensor_data_v1 WHERE co2_ppm < 300 OR temperature_celsius < 15 limit 100 | 10 | before |
| 2.35 | SELECT COUNT(DISTINCT(serial_number)) FROM dfs.co2meter.sensor_data_v2 WHERE timestamp >= UNIX_TIMESTAMP('2023-01-15 00:00:00') | 11 | after |
| 8.04 | SELECT COUNT(DISTINCT(serial_number)) FROM dfs.co2meter.sensor_data_v1 WHERE timestamp >= UNIX_TIMESTAMP('2023-01-15 00:00:00') | 11 | before |